
Analytics & Reporting

Analytics & Reporting
“From data to decisions — empowering your growth with insights that matter.”
Introduction
In the digital world, every click, view, and interaction tells a story.
But raw data alone doesn’t help unless it’s analyzed, understood, and turned into action.
At Digital Journey, our Analytics & Reporting service helps you:
Understand your customers’ behavior deeply.
Measure the real impact of your marketing efforts.
Identify hidden opportunities for growth.
Make data-driven decisions with confidence.
Our mission is simple: to convert complex numbers into clear, actionable strategies that drive measurable results for your business.
Why Analytics & Reporting is Essential for Every Business
Analytics isn’t just about numbers — it’s about business intelligence.
Here’s why it matters:
1. Measure Success Effectively ✅
Find out which marketing campaigns are working best.
Understand customer engagement levels across all channels.
Set clear goals and track progress accurately.
2. Eliminate Guesswork 🎯
Stop relying on assumptions or gut feelings.
Use real-time data to make informed, confident decisions.
3. Optimize Marketing Spend 💰
Identify underperforming campaigns and reallocate budget wisely.
Ensure maximum ROI (Return on Investment) on every marketing dollar spent.
4. Understand Customer Behavior 🧑🤝🧑
See how customers interact with your brand at each stage of the buyer journey.
Use this data to personalize experiences and increase conversions.
5. Stay Ahead of Competitors 🚀
Track industry trends and competitor activities.
Adjust strategies quickly based on market movements.
6. Make Future-Proof Decisions 🔮
Predict future growth opportunities using historical data trends.
Stay ready for market changes before they happen.
Our Analytics & Reporting Services
We provide a complete, end-to-end analytics solution tailored to your business needs
1. Web Analytics 🌐
We track and analyze your website’s performance to ensure it drives growth.
What we measure:
Total website visits & unique visitors.
User behavior (clicks, page views, bounce rate).
Traffic sources:
Organic (SEO)
Paid ads (PPC)
Social media
Direct visits
Conversion tracking:
Leads generated
Purchases completed
Form submissions
Identify pages with high exit rates to improve user experience.
Tools Used:
Google Analytics 4 (GA4)
Google Tag Manager (GTM)
Hotjar / Crazy Egg (Heatmaps)


2. Campaign Tracking & Reporting 🎯
Get complete visibility into every digital marketing campaign.
What we track:
Google Ads performance (clicks, cost-per-click, conversions).
Facebook & Instagram ad engagement.
SEO progress (keyword rankings, organic traffic).
Email marketing open rates & click-throughs.
ROI tracking for each campaign.
Benefits:
Identify top-performing campaigns.
Optimize ad spend for better conversions.
Create a clear roadmap for marketing success
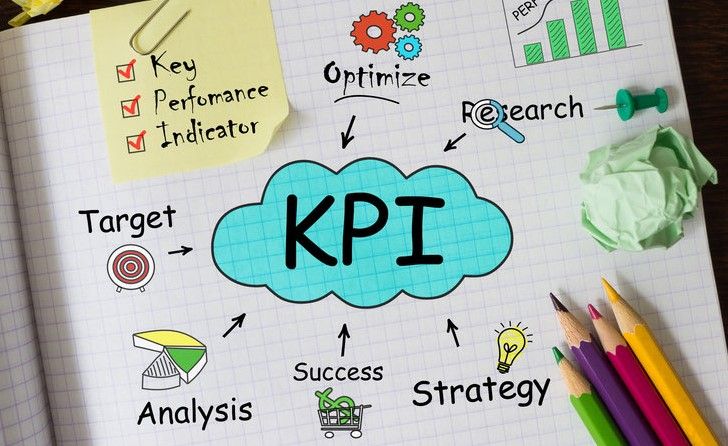
3. KPI Measurement 📈
We define and track Key Performance Indicators aligned with your business goals.
Examples of KPIs we track:
Website traffic growth percentage.
Conversion rate optimization (CRO).
Customer Acquisition Cost (CAC).
Return on Ad Spend (ROAS).
Lifetime Value (LTV) of customers.
Social media engagement metrics.
This ensures every action we take is measurable and results-driven

4. Customer Journey Analytics 🗺️
We help you understand your customers at every step of their journey.
Insights include:
How customers discover your brand.
The pages or ads they engage with most.
Where they drop off before converting.
How to personalize experiences for higher engagement.
Why it matters:
When you know what your customers want, you can deliver better service and increase loyalty
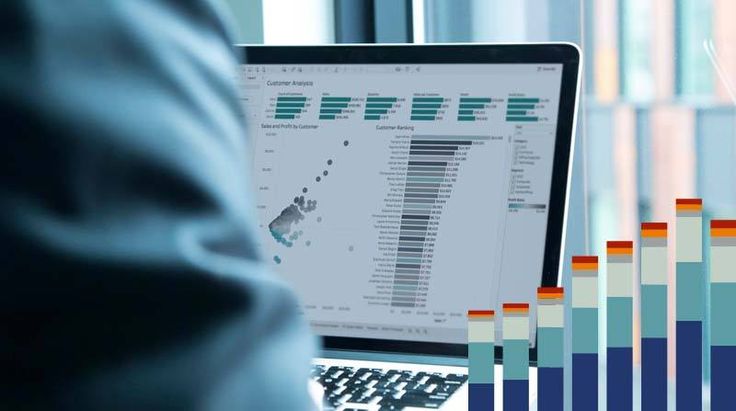
5. Custom Dashboard Creation 🖥️
Get easy-to-read, real-time dashboards designed specifically for your business.
Features:
Live updates of marketing metrics.
Simple, visual representation of data (charts, graphs, KPIs).
Accessible on desktop and mobile.
Fully customizable based on your priorities.
Tools Used:
Looker Studio (formerly Google Data Studio)
Microsoft Power BI
Tableau
No more confusing spreadsheets — just clear, visual data insights.
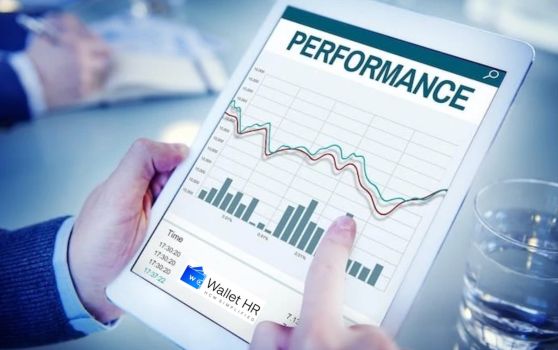
6. Monthly Performance Reports 📑
Every month, you’ll receive a detailed, easy-to-understand report.
Report includes:
Summary of monthly performance.
Campaign-by-campaign breakdown.
Traffic and sales analysis.
Insights on what’s working and what needs improvement.
Action steps for the next month.
We also offer quarterly strategy meetings to review long-term progress.
Our Analytics & Reporting Process
We follow a step-by-step approach to ensure success:
Step 1: Initial Audit & Setup 🔍
Review your existing analytics setup.
Identify gaps and areas for improvement.
Step 2: Goal Definition 🎯
Work with you to set measurable business goals.
Establish KPIs aligned with your objectives.
Step 3: Data Collection 📊
Implement advanced tracking tools.
Collect data from all marketing channels.
Step 4: Analysis & Insights 🧠
Analyze data to identify trends, opportunities, and weaknesses.
Step 5: Customized Reporting 📑
Deliver reports tailored to your business needs.
Step 6: Continuous Optimization ♻️
Adjust campaigns based on insights.
Improve results month over month.
Tools We Use for Analytics
We utilize industry-leading analytics platforms for accuracy and reliability:
Google Analytics 4 (GA4) – Website tracking.
Google Tag Manager (GTM) – Event tracking.
Google Search Console – SEO performance.
SEMrush / Ahrefs – Keyword and competitor tracking.
Hotjar / Crazy Egg – Heatmaps and session recordings.
Looker Studio – Custom dashboards.
Power BI & Tableau – Advanced data visualization.
Industries We Serve
Analytics & Reporting is crucial for businesses of all industries, including:
E-commerce & Retail 🛍️ – Track sales funnels and customer trends.
Real Estate 🏠 – Measure lead generation and ad performance.
Healthcare & Wellness 🏥 – Understand patient inquiries and service demand.
Education & Coaching 🎓 – Monitor student enrollment campaigns.
Technology & Startups 💻 – Scale operations effectively using growth data.
Travel & Hospitality ✈️ – Optimize bookings and marketing ROI.
Service-Based Businesses ⚙️ – Track appointments and client satisfaction.
Benefits of Our Analytics & Reporting
When you choose Digital Journey, you get:
✅ Complete transparency in marketing performance.
📈 Clear, actionable insights that drive growth.
💰 Smarter budget allocation for higher ROI.
📝 Custom reports designed for your team.
🔍 24/7 access to real-time dashboards.
⚡ Faster decision-making with data-backed strategies.
Client Testimonials – Analytics & Reporting
“See how businesses are making smarter decisions with data-driven insights.”
At Digital Journey, we believe data is the key to sustainable growth.
Our Analytics & Reporting services help businesses turn raw data into actionable strategies that deliver measurable results.
Here’s what our clients have to say about their experience with us.
1. Priya Mehta – CEO, GlamKart E-commerce 🛍️
⭐ 5.0 / 5
“Before working with Digital Journey, we were spending heavily on ads but had no clear understanding of ROI.
Their team created custom dashboards and gave us real-time reports on our website and ad performance.
Within 3 months, we were able to reduce ad wastage by 30% and increase sales by 45%.
Now, every marketing decision we make is backed by accurate data. Truly game-changing!”
Service Used: Web Analytics, KPI Tracking, Custom Dashboards
Result:
📉 Reduced ad spend wastage by 30%.
📈 Increased total sales by 45%.
2. Arjun Singh – Marketing Head, FitLife Wellness Center 🏥
⭐ 4.9 / 5
“We run multiple campaigns for memberships, events, and product sales.
It was always a struggle to track which campaigns were actually working.
Digital Journey set up a centralized reporting system that gave us a clear view of performance across all platforms.
Thanks to their insights, we shifted our focus to high-performing channels and saw a 60% boost in membership sign-ups within two months.”
Service Used: Campaign Tracking, Monthly Reports, Conversion Optimization
Result:
🚀 60% increase in new memberships.
🎯 Complete visibility into marketing ROI.
3. Sneha Kapoor – Founder, EduGrow Coaching Academy 🎓
⭐ 5.0 / 5
“As an education provider, we needed to understand student behavior and enrollment patterns.
Digital Journey created a custom student analytics dashboard that tracks every stage of the enrollment journey.
This helped us identify bottlenecks in our marketing funnel and fix them quickly.
In just one quarter, our lead-to-enrollment conversion rate improved by 50%, and we are now enrolling 25% more students every month.”
Service Used: Customer Journey Analytics, Funnel Tracking, KPI Reports
Result:
📈 50% improvement in conversion rate.
🎓 25% increase in monthly enrollments.
4. Rohan Malhotra – Director, TravelXperience Holidays ✈️
⭐ 4.8 / 5
“Our travel agency was generating leads, but we had no clarity on which marketing channels were profitable.
Digital Journey implemented a detailed analytics framework for our campaigns and bookings.
We were able to identify top-performing channels and cut down on wasteful spending.
This resulted in a 35% boost in bookings and a 25% reduction in ad costs within three months.”
Service Used: ROI Tracking, Performance Reports, Dashboard Setup
Result:
📈 35% increase in total bookings.
💰 25% reduction in ad costs.
5. Neha Sharma – Co-Founder, TechNova Solutions 💻
⭐ 5.0 / 5
“As a startup, we were scaling quickly but lacked data transparency.
Digital Journey provided us with a custom analytics dashboard that integrates website analytics, ad performance, and customer metrics in one place.
Now, we make decisions based on real-time insights, not assumptions.
Their team has helped us streamline reporting, saving us hours of manual work every week.”
Service Used: Custom Dashboard Creation, Monthly Analytics Reports
Result:
⏱️ Saved 10+ hours per week in manual reporting.
⚡ Faster, data-backed decision-making.
Analytics & Reporting – FAQ Section
“Clear answers to help you understand how our Analytics & Reporting services can transform your business.”
1. What is Analytics & Reporting, and why is it important?
Analytics & Reporting involves collecting, analyzing, and presenting data to understand how your marketing strategies and business are performing.
It’s important because it:
Tracks what’s working and what’s not.
Helps optimize campaigns for better results.
Provides data-driven insights to grow your business.
Measures ROI (Return on Investment) accurately.
2. How does Analytics & Reporting benefit my business?
With accurate analytics, you can:
Increase revenue by focusing on high-performing channels.
Reduce wasteful ad spending.
Make informed decisions backed by real data.
Track customer behavior and improve their experience.
Identify growth opportunities and stay ahead of competitors.
3. What tools do you use for analytics and reporting?
At Digital Journey, we use the latest and most reliable tools to ensure accurate tracking:
Google Analytics 4 (GA4) – For website performance tracking.
Google Search Console – For SEO insights.
Looker Studio (Google Data Studio) – For live dashboards.
SEMrush & Ahrefs – For SEO reporting.
Power BI & Tableau – For custom data visualization.
Google Ads Manager – For ad campaign tracking.
Facebook Business Suite – For social media performance.
4. Can I access my analytics dashboard in real-time?
Yes!
We create custom, interactive dashboards that you can access anytime.
You’ll be able to:
View live campaign performance.
Check traffic sources, conversions, and sales.
Make quick decisions without waiting for monthly reports.
5. How often will I receive performance reports?
We provide:
Monthly reports with detailed insights and growth comparisons.
Weekly snapshots (if requested) for quick performance checks.
Real-time access through your dashboard so you’re always up-to-date.
6. How do you measure ROI (Return on Investment)?
We track ROI using clear and measurable metrics, such as:
Conversion rates (leads, sales, sign-ups).
Customer acquisition costs (CAC).
Return on ad spend (ROAS).
Revenue generated from each channel.
Year-over-year growth trends.
This helps you understand which campaigns bring the best returns.
7. Do you customize reports based on my business goals?
Absolutely!
We know every business is unique, so we:
Identify your specific KPIs (Key Performance Indicators).
Build reports tailored to your needs.
Focus on the metrics that matter most to your growth.
8. How secure is my business data?
Your data security is our top priority.
We ensure:
End-to-end encryption of data.
Access given only to authorized team members.
Regular backups and updates to prevent data loss.
Compliance with privacy regulations, including GDPR.
9. Can Analytics & Reporting help me reduce my marketing costs?
Yes!
With detailed analytics, you can:
Identify wasteful spending on underperforming campaigns.
Focus on high-converting channels.
Optimize your budget for maximum ROI.
Many of our clients have cut costs by 20-30% while increasing conversions.
10. What industries can benefit from Analytics & Reporting?
Analytics is universal and works for every industry, including:
E-commerce & Retail – Track product performance and sales trends.
Healthcare & Wellness – Measure patient inquiries and marketing ROI.
Education & Coaching – Monitor enrollment campaigns.
Technology & Startups – Scale growth with real-time insights.
Real Estate – Track lead generation and conversions.
Hospitality & Travel – Optimize bookings and marketing spend.
11. Do I need technical knowledge to understand the reports?
No!
We design easy-to-read reports with:
Clear visuals, graphs, and charts.
Simple explanations in plain language.
A dedicated account manager to walk you through the results.
You don’t need to be a data expert — we make everything simple and actionable.
12. How do I get started with your Analytics & Reporting services?
Getting started is easy:
Free Consultation – Discuss your goals and challenges.
Audit & Setup – We review your current analytics tools and fix any gaps.
Custom Dashboard Creation – Build a system tailored to your needs.
Ongoing Reporting & Insights – Provide continuous tracking and optimization.
 Office Address: Jaipur, Rajasthan, India
 Email: digitaljourney63@gmail.com